Best-practice reports & expected reimbursements
Step 1 — Run the Best Practice reports
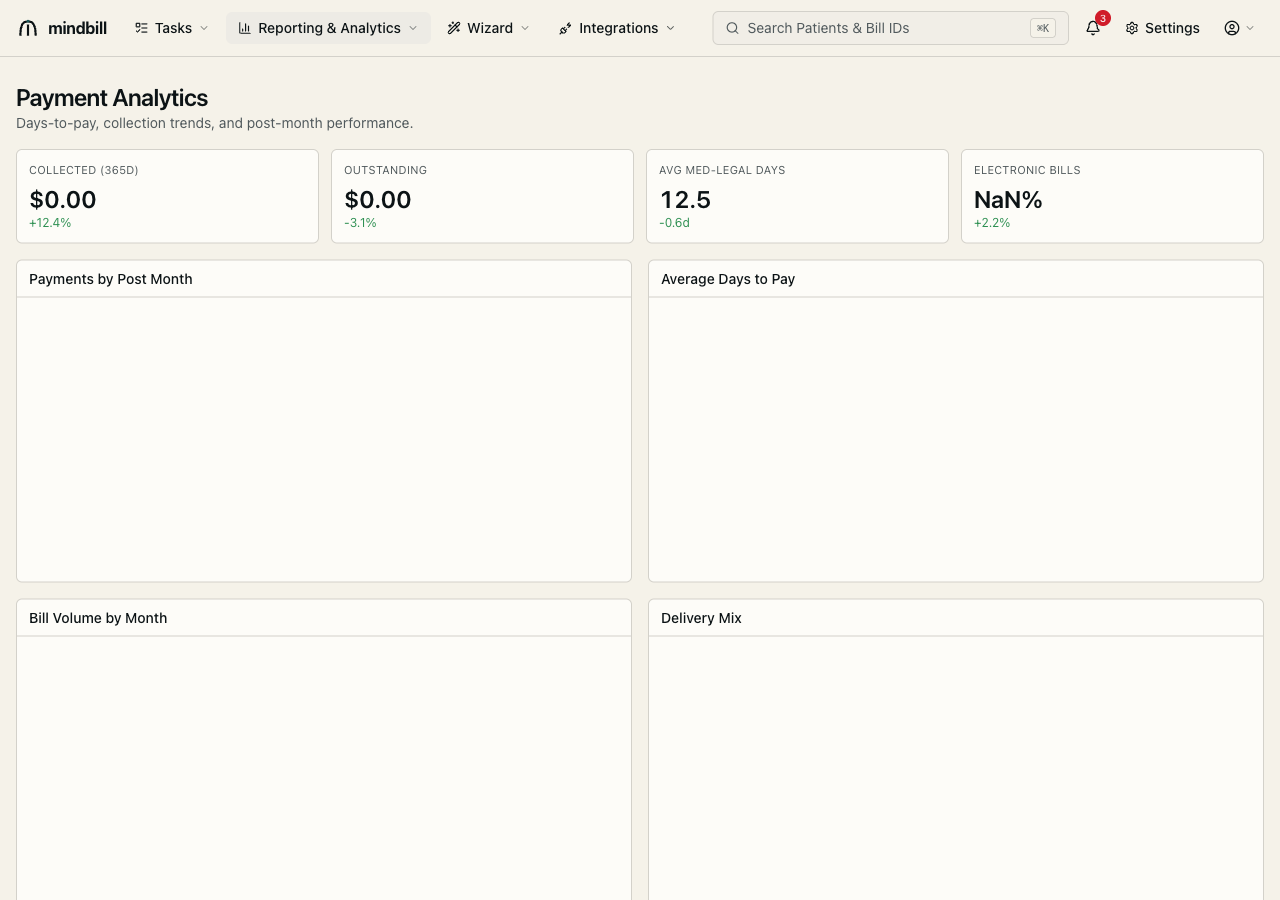
Under Reports, the Best Practice category holds the six reports, each scoped to a fixed window and exportable to CSV: Bills by Submission Type and Payments by Submission Type (grouped Original / Second Review / Duplicate / Corrected), Bills by Claims Administrator (count + total billed per payer), Count of Service Line Items (per-CPT line count + billed value, with a flat per-line export), Bills by Date of Service, and Deposit Summary (payments deposited, grouped by rendering provider x place of service). Most run on last month; Bills by Date of Service runs on last week. These are the operational tallies you hand to a provider or pull for a month-end reconcile.
Step 2 — Read the 13-Week Cash Forecast
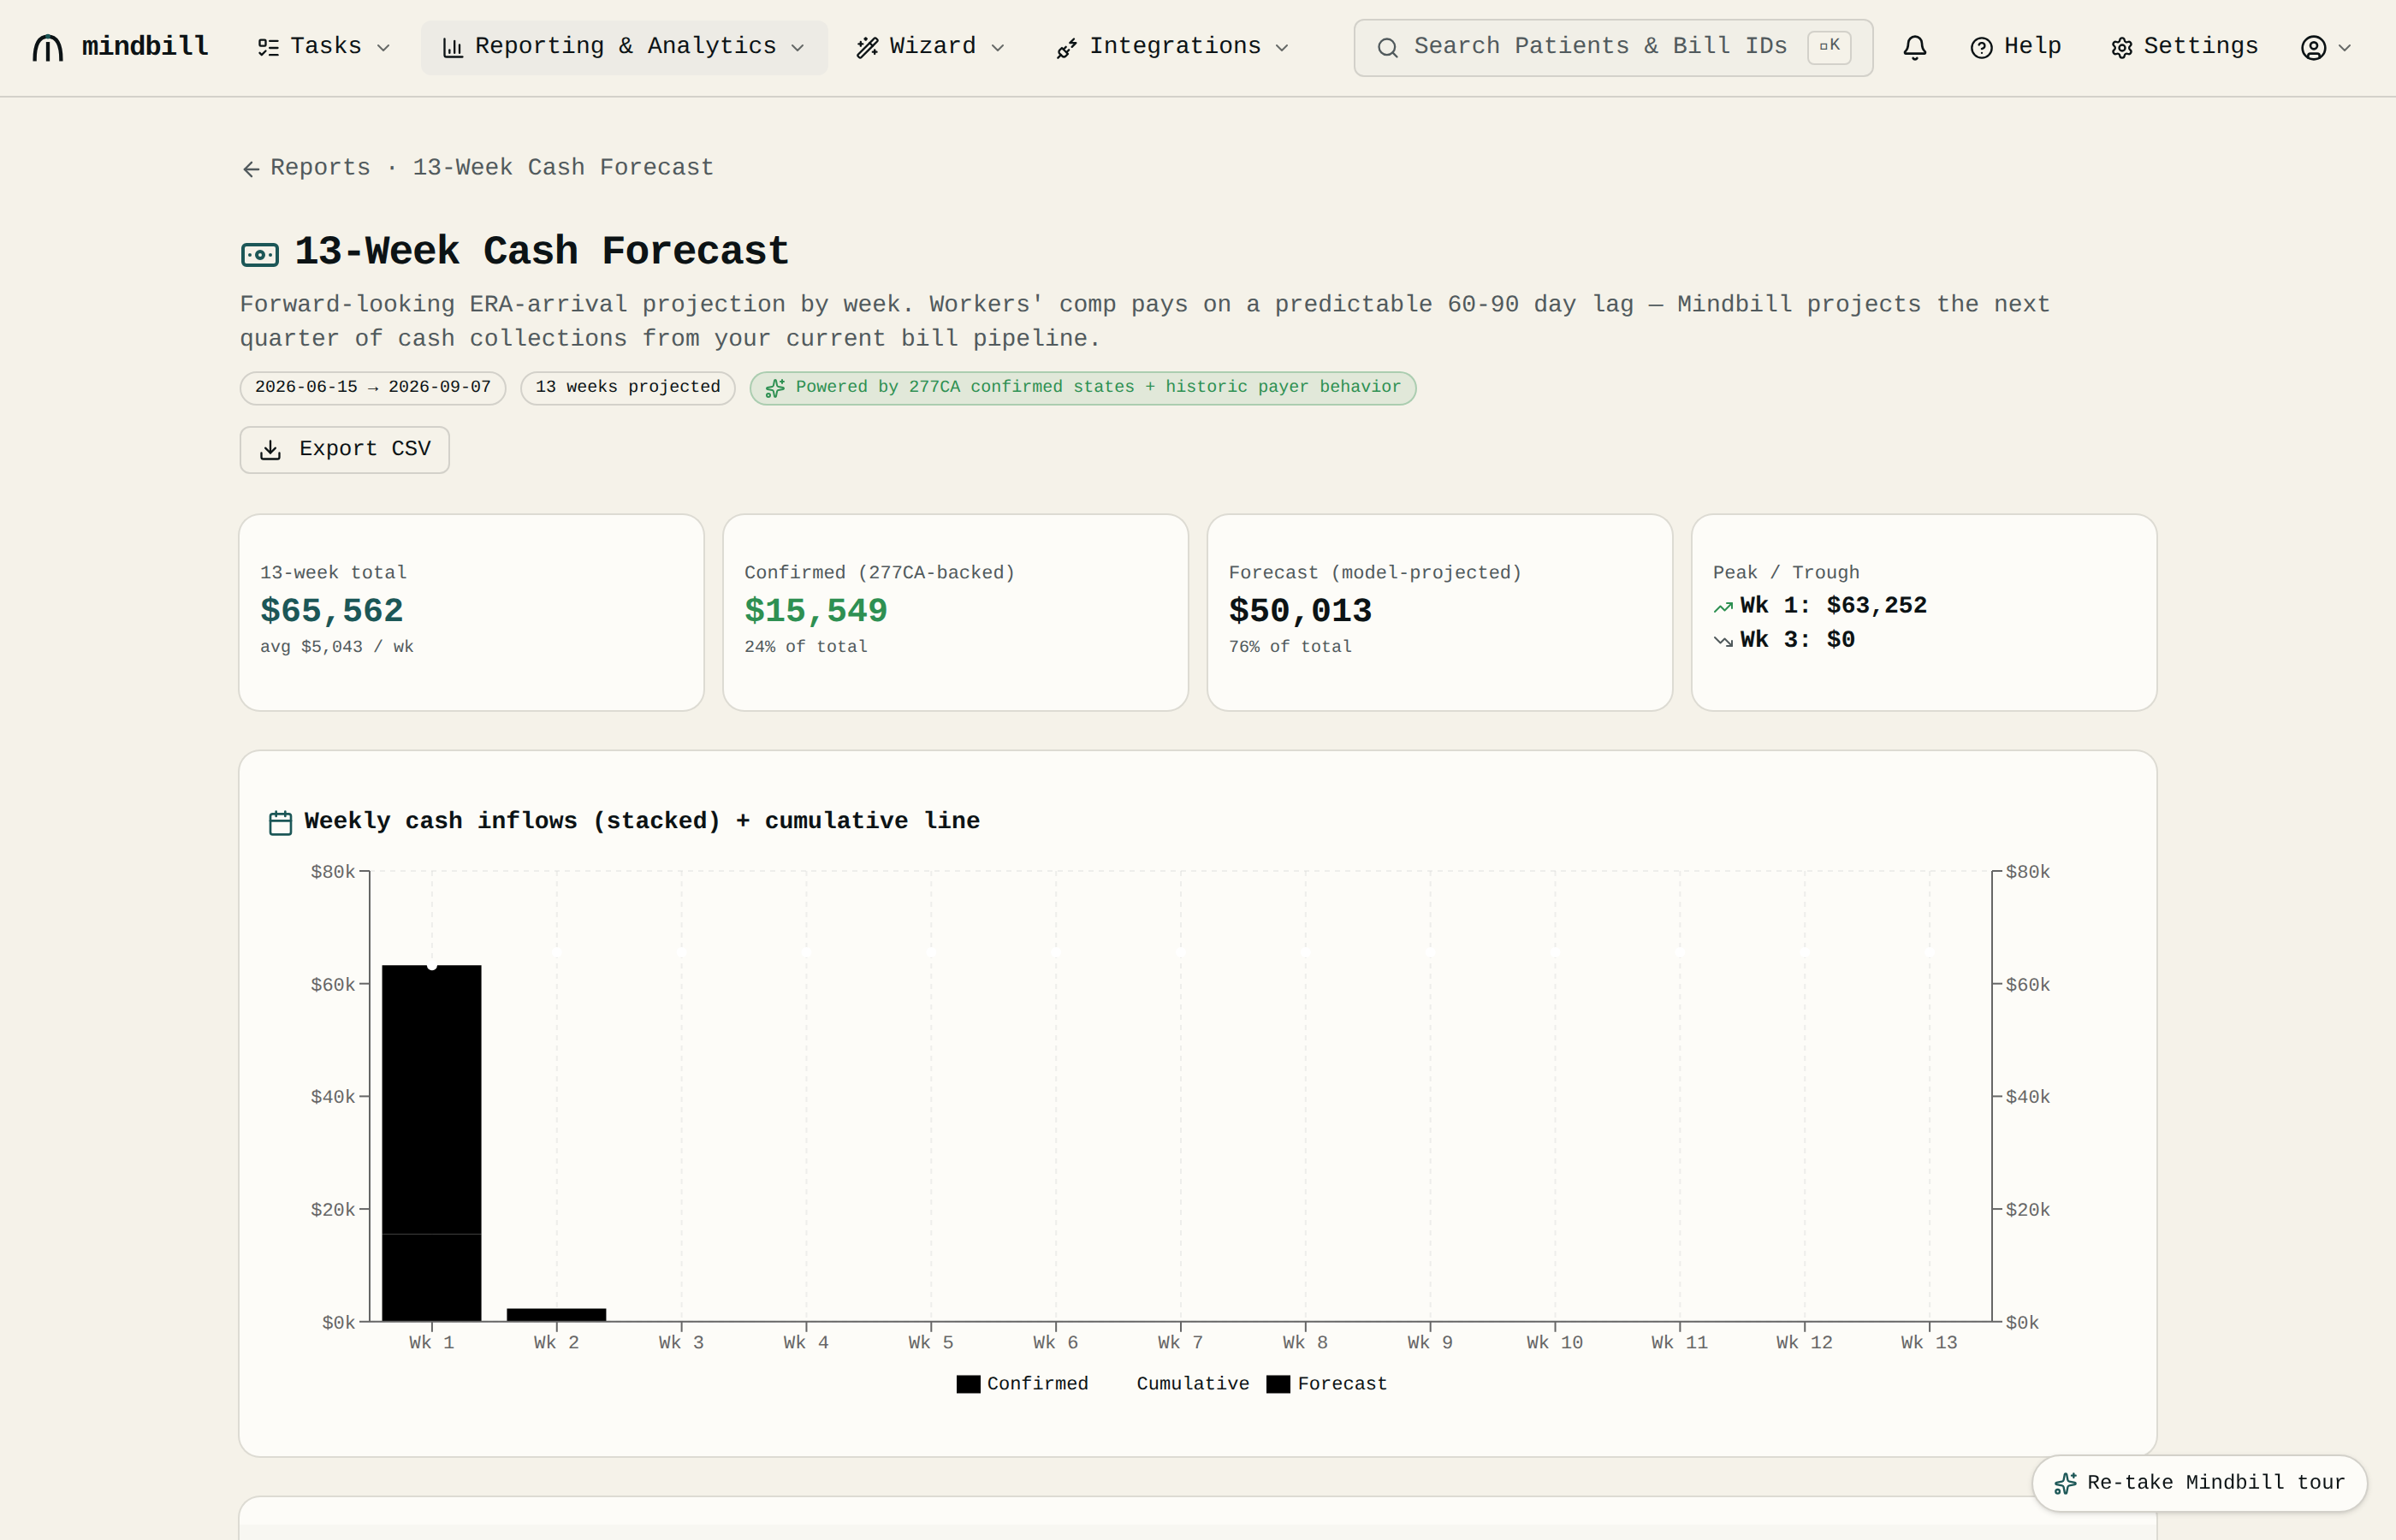
Open Reports -> 13-Week Cash Forecast (/reports/cash-forecast). Workers' comp pays on a predictable lag, so Mindbill projects the next quarter of cash from your current pipeline. It takes every open bill (one with an outstanding balance, not voided, not already fully paid) and projects that balance to arrive on the bill's sent date — or its date of service if it hasn't been sent — plus the claims administrator's historic med-legal days-to-pay, then buckets those arrivals into the next 13 weeks. Anything already past due lands in week 1. The KPIs across the top show the 13-week total and weekly average, and the peak and trough weeks; the stacked weekly chart carries a cumulative line.
Step 4 — Understand the methodology (and where the per-bill amount comes from)
The forecast is a live client-side calculation, not a saved nightly model — it re-computes whenever bills, EORs, and acknowledgments change. There's no blended net-collection rate or payer-mix weighting; each bill simply projects its own outstanding balance to its own arrival week. Two inputs drive it: the bill's balance due, and the payer's average med-legal days-to-pay (a per-administrator figure; when a bill's payer isn't mapped, Mindbill falls back to a 70-day industry default). That balance-due figure traces back to the line's expected/allowed amount — set by your active Expected Reimbursements table (Settings -> Expected Reimbursements) when a CPT matches, or its OMFS-calculated allowed when none does. Get those right and the forecast tightens to reality.