Reading your reports & analytics
Step 1 — Open the report library
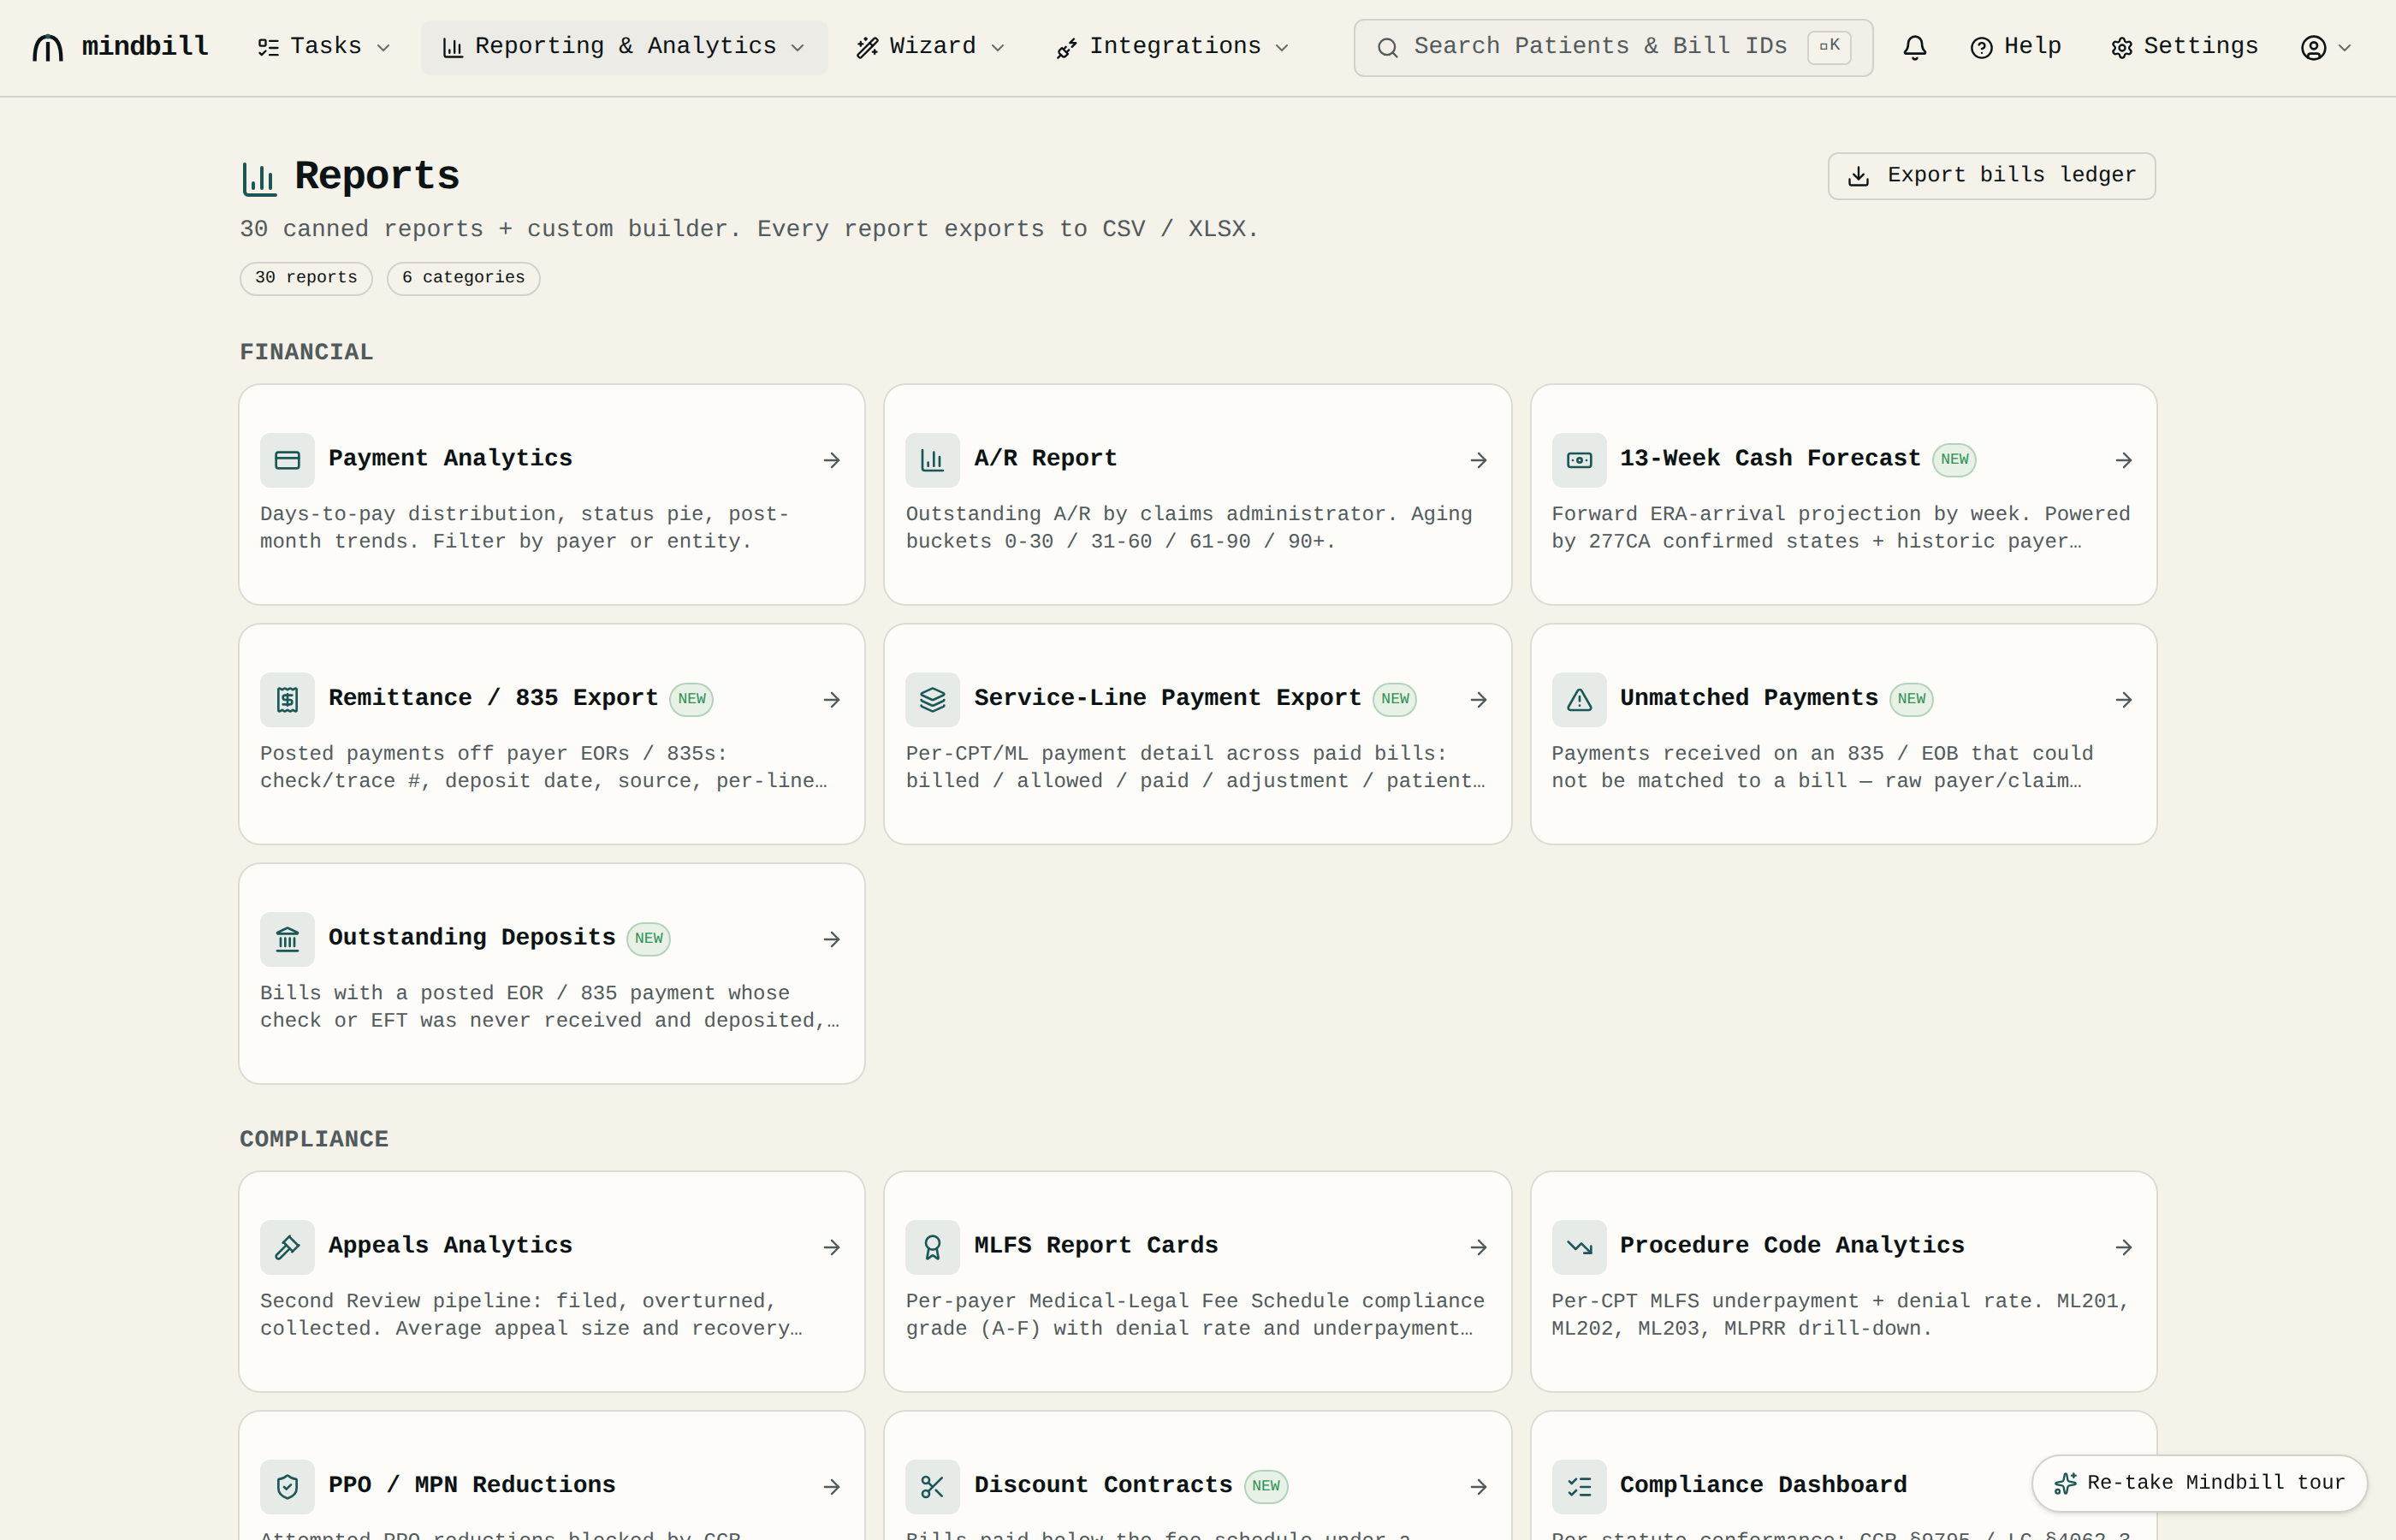
Open Reports (the page is titled Reports). You get a full library grouped by purpose — financial, compliance, recovery, and operations — and every report exports to CSV. The Compliance group, anchored by the Compliance Dashboard, rolls up appeals, MLFS report cards, and PPO/MPN reductions. It's the one place to answer what's outstanding, who's slow-walking you, and what's coming in.
Step 2 — Read the A/R Report
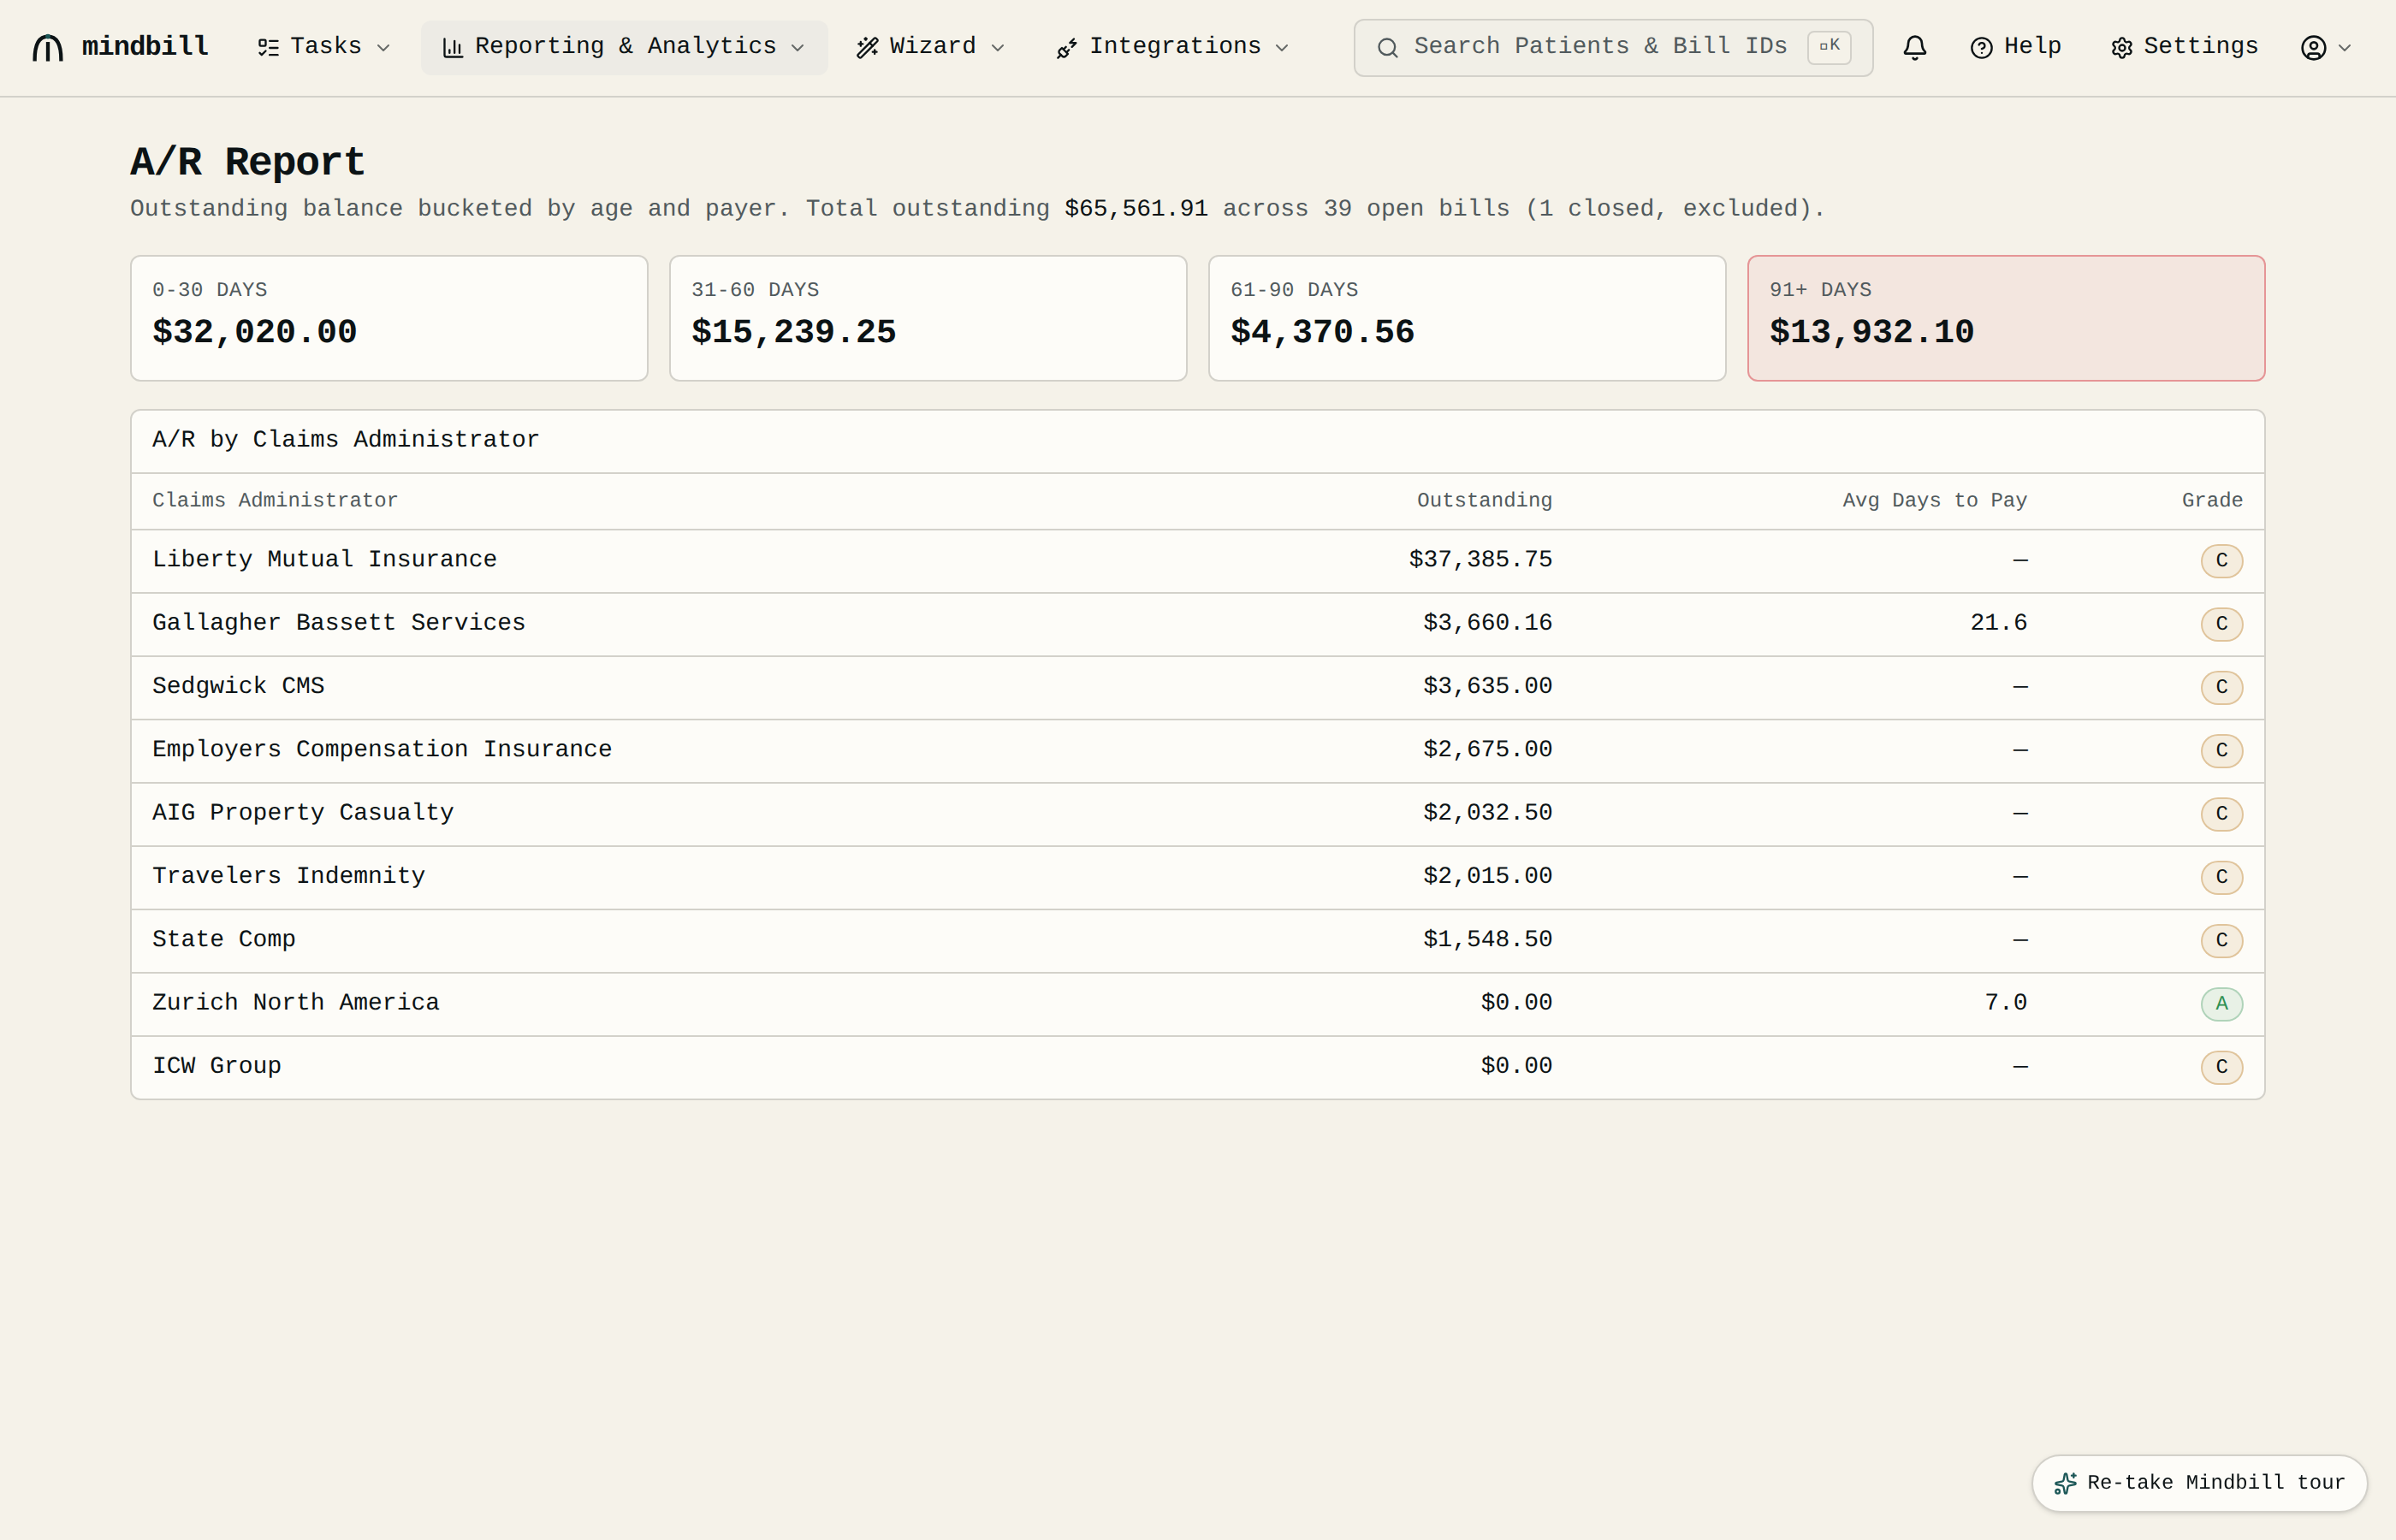
The A/R Report buckets outstanding balances by days since the bill was submitted — 0–30, 31–60, 61–90, and 91+ days — rather than by date of service. Select any bucket or claims administrator to open the individual outstanding bills, then export that exact worklist to CSV with submission date, age, billed, paid, and balance due.
Step 3 — Read Payment Analytics
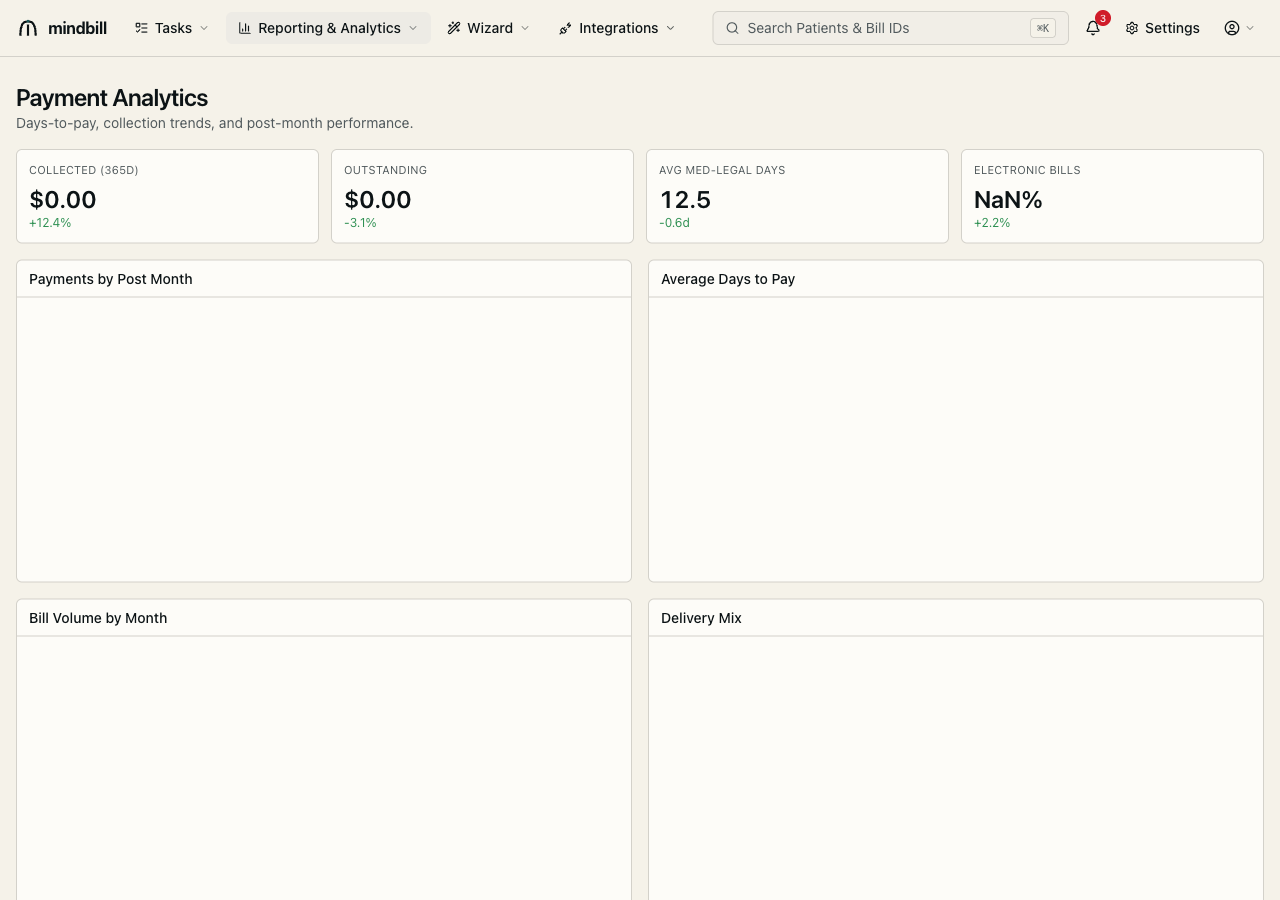
Payment Analytics shows the money in motion: collected versus outstanding, average days-to-pay, and your electronic-billing share. The Average Days to Pay chart splits e-bill (~10 days) from paper (~38) — the case for pushing everything to EDI — and collection and days-to-pay trends by month show whether collections are keeping pace with the bills you send.
Step 4 — Read the 13-week cash forecast
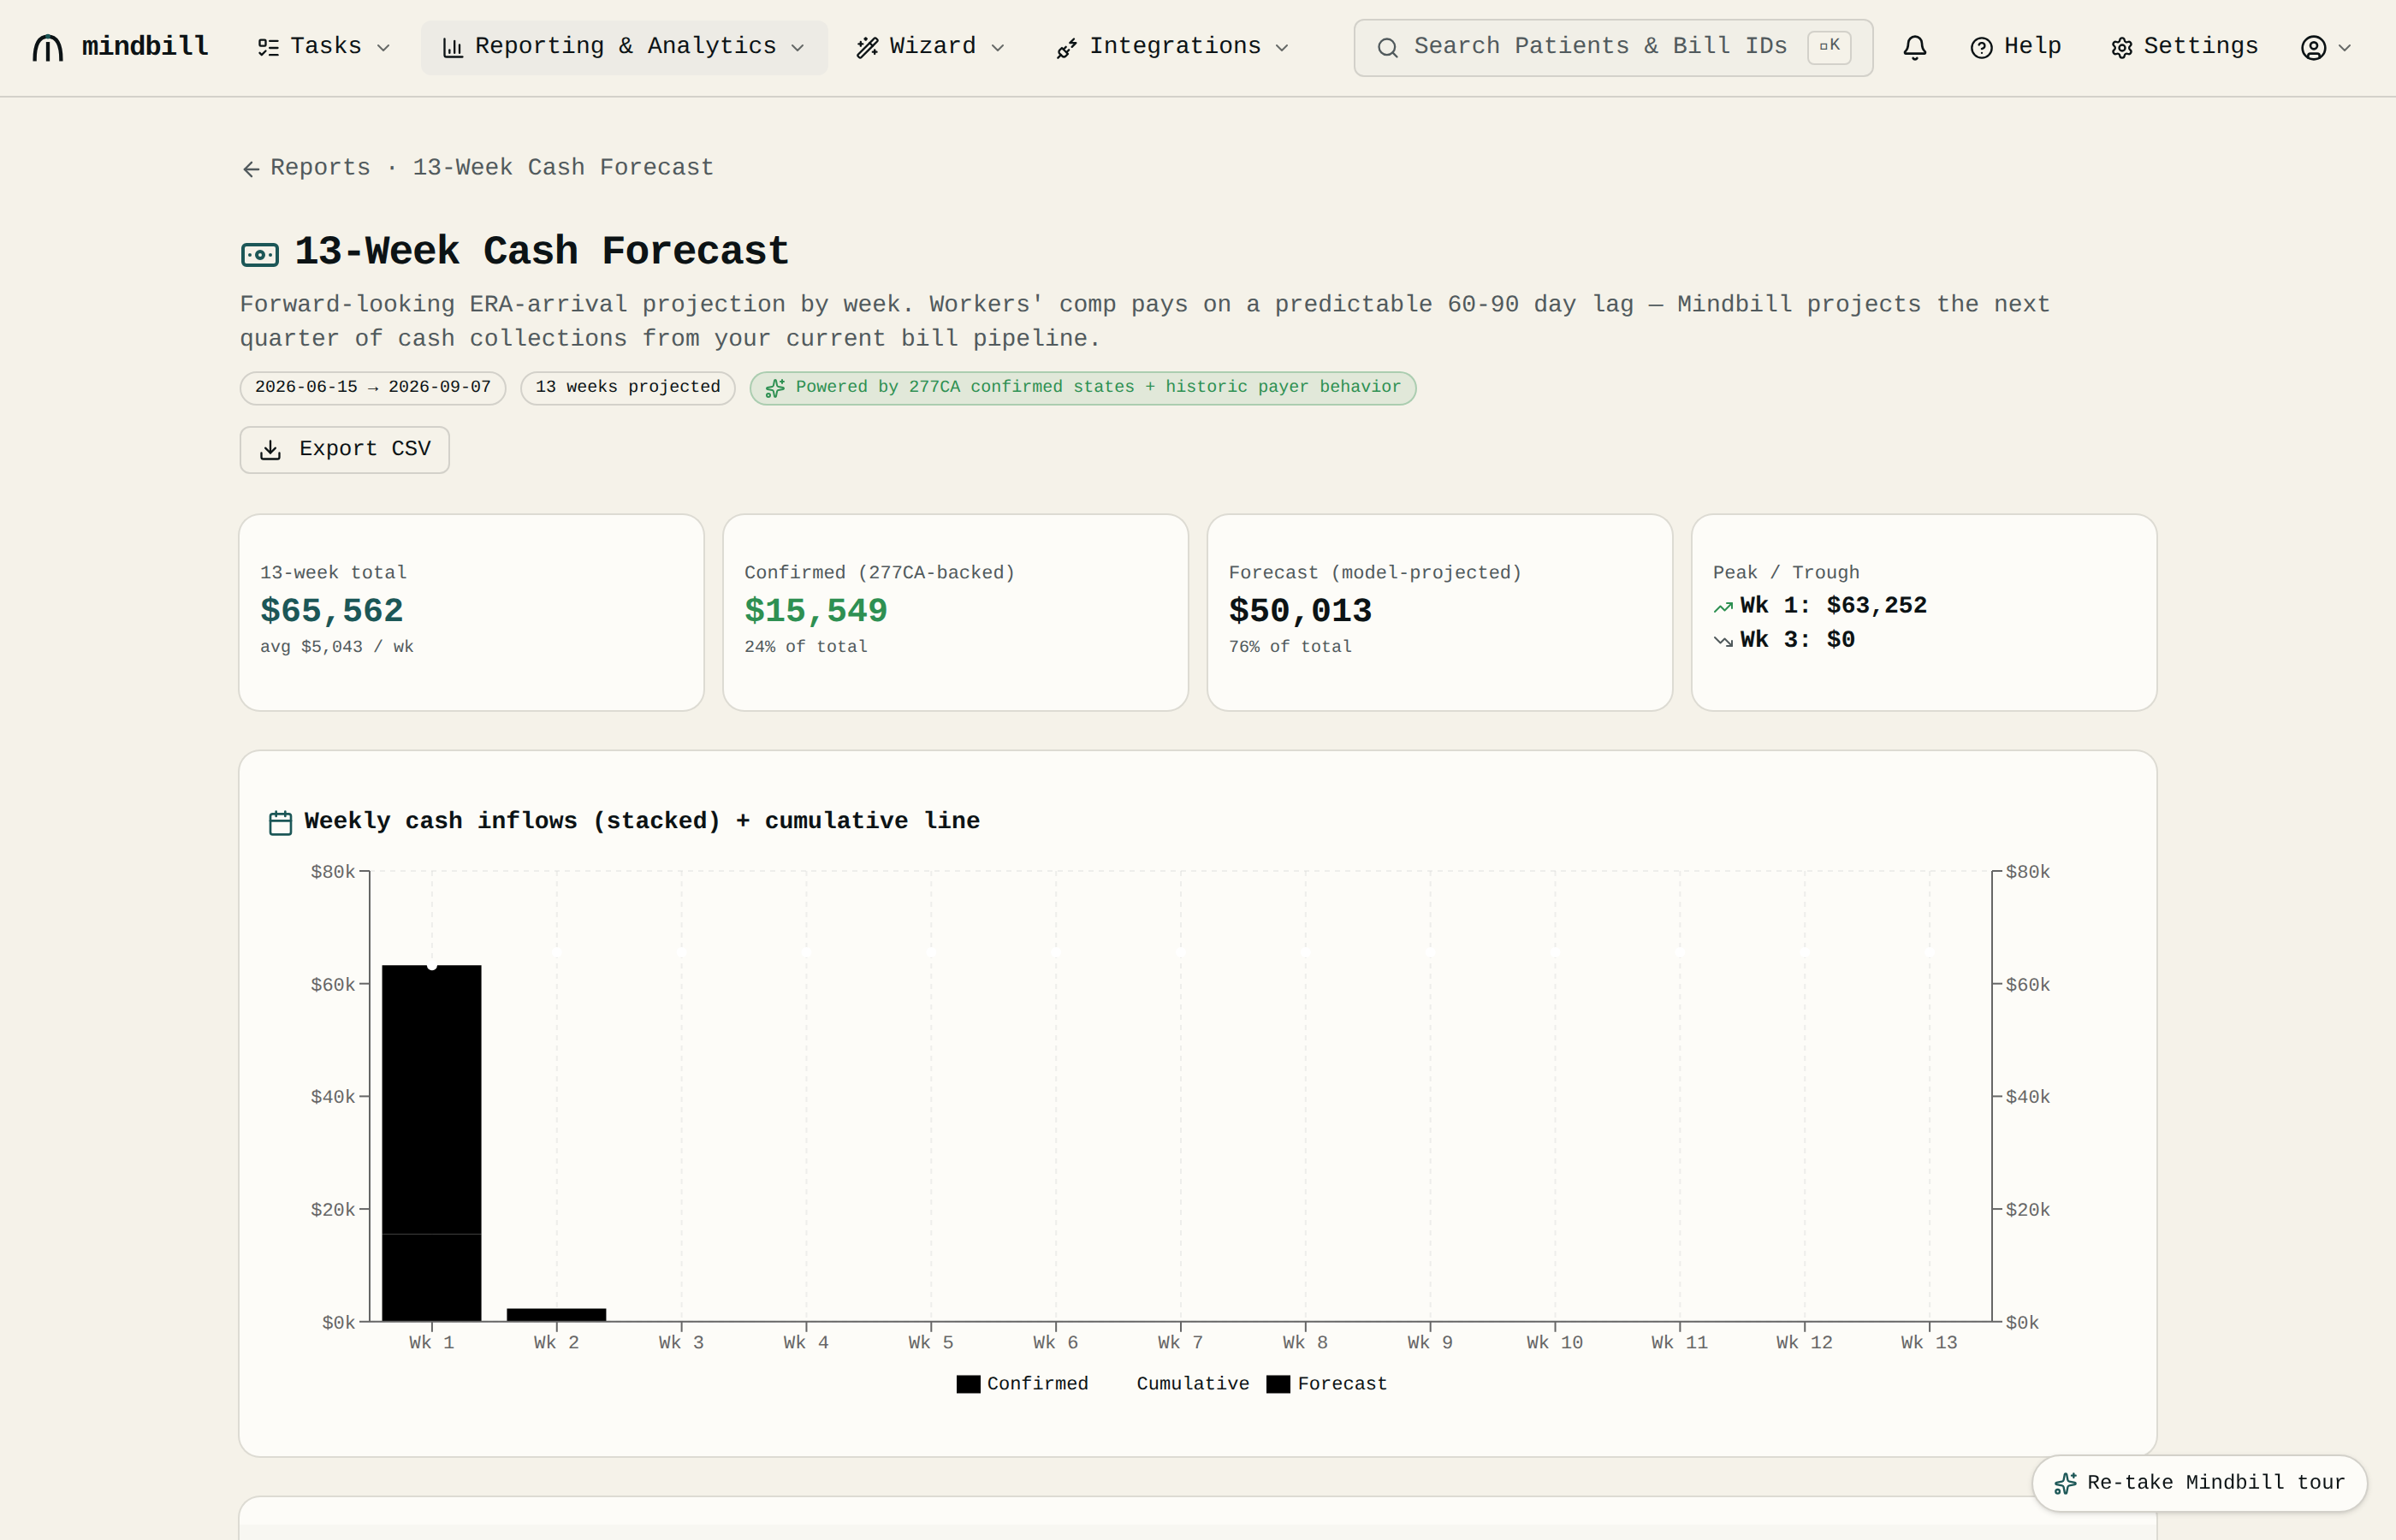
The 13-Week Cash Forecast projects ERA arrivals from your current pipeline — the portion confirmed by 277CA acknowledgments plus the rest modeled from each payer's historic days-to-pay — so you can see next quarter's cash week by week. Workers' comp pays on a predictable 60–90 day lag, which is what makes the projection plannable.
Step 5 — Build a custom report and export to CSV
Need something specific? The Custom Report Builder lets you filter by status, set any date range, and group on the fly — for example, paid bills over the last year, grouped by claims administrator. The table recomputes live as you change the filters. Then it's one click to Export CSV, and the exact breakdown you're looking at is in your hands — at-a-glance financial visibility, ready to reconcile or hand to an accountant.